Chapter 5 Discussion
5.1 Reflection on Results
5.1.1 Spatio-Temporal Distribution
According to the trend shown in figure 4.1, in the 20 years since 1998, although the industry concentration in England fluctuated from 2002 to 2010, the overall average level has been reduced by about 70%. This means that after 2010, many new technology industry companies have joined the England region every year, resulting in a rising diversity of the technology industry. The British government (2016) mentioned in its official statistics report on industry concentration that Telecoms, which is more related to the technology industry, experienced a significant increase in indicators from 2006 to mid-2015 and then began to decline. Comparing the results in England, the overall concentration of the technology industry is in a downward trend. This phenomenon may affect the above-mentioned macro-industry trends.
Echoing the trend of increasing industry diversity is the rising trend of entry rate and company density. According to the results shown in figure 4.1 starting in 2016, the growth rate of the two indicators has suddenly increased compared to the indicator trend before 2008. This phenomenon may be due to the UK government(2017) plans to spend more than £1 billion to speed up the development and adoption of next-generation digital infrastructure in their policy paper. It can be seen that the prosperity of the industry, information and policies may promote each other.
From the perspective of geographical and temporal distribution, as an emerging technology cluster with a higher entry rate, northern England performed well after 2008 (above the average level). However, the central region, relying on Manchester and Birmingham and other regions, also has an above-average level in the medium term(2008). Combined with figure 4.3, the overall concentration of science and technology industries in the north is higher than that in the south. However, the industrial diversity in the London area has always been high, and there is no obvious trend of change. It is worth noting that the decline in industrial concentration in the central region has the most obvious effect. The corresponding growth in the entry rate of these regions is also obvious (Figure 4.2)
5.1.2 Firm Dynamics and Influence Factors
The regression results between the three variables found that in England, the more diverse the technology industry and the greater the density of technology companies, the greater the entry rate of regional technology companies. It is worth noting that the data of the London area in 2018 were excluded as outliers in the partial regression model. This is because the entry rate value in this year far exceeds the value in other years in other regions. This phenomenon may also be related to the rapid development of AI venture capital in the London area in 2018. For instance, between 2015 and 2017, the AI sector in London had a 200 percent growth in venture capital funding, and the city now has 13 universities offering AI-related degrees(Taylor,2018; Allott et al., 2018).
Meanwhile, the direct effect of firm density on firm dynamics seems to be more significant than the effect of industry concentration. Industry diversity often first acts on regional market performance and other factors, thereby indirectly affecting dynamics. Combining the large number of SMEs, mentioned in the literature section, tends to provide employment growth better than the small number of large companies (Liu et al., 1999). Regions with large industry diversity may also have more small companies, which also explains the negative impact of high industry concentration on the increase of entry rate.
5.1.3 Spatio-Temporal Cluster Analysis for Two Indicators
Overall, the agglomeration effect of two indicators (firm dynamics and density) in England will reduce over time. However, the density index has a greater degree of reduction compared to the entry rate’s cluster effect (Table 4.5). From the perspective of temporal and spatial trends, the north has gradually become a hot spot for the entry rate. More and more tech companies have joined the north and this phenomenon has local spatial autocorrelation. At the same time, these high entry rate regional clusters will be transferred to Liverpool and its surrounding areas in the later stage (2018). In the southwestern corner, the high entry rate hotspot from the beginning has gradually become a low entry rate cluster in the 10 years since 2008. How to implement policy encouragement and adjustments to make their technology industry rejuvenate may be a challenge to local authorities.
The LISA analysis of the firm density is used to supplement the exploratory description of the spatial model in this study. In figure 5.1, it might be a continuous pattern that London and its surrounding commuting areas have always had high-density clusters in these three periods although this spatial pattern may be weakened. Although there are also low-density clusters in the northern area, this might be related to the England railway line and transportation planning. The weakening effect of low-density clustering in this area is more obvious. These urban areas that are different from the London metropolitan area also have a certain absorption potential for new enterprises.
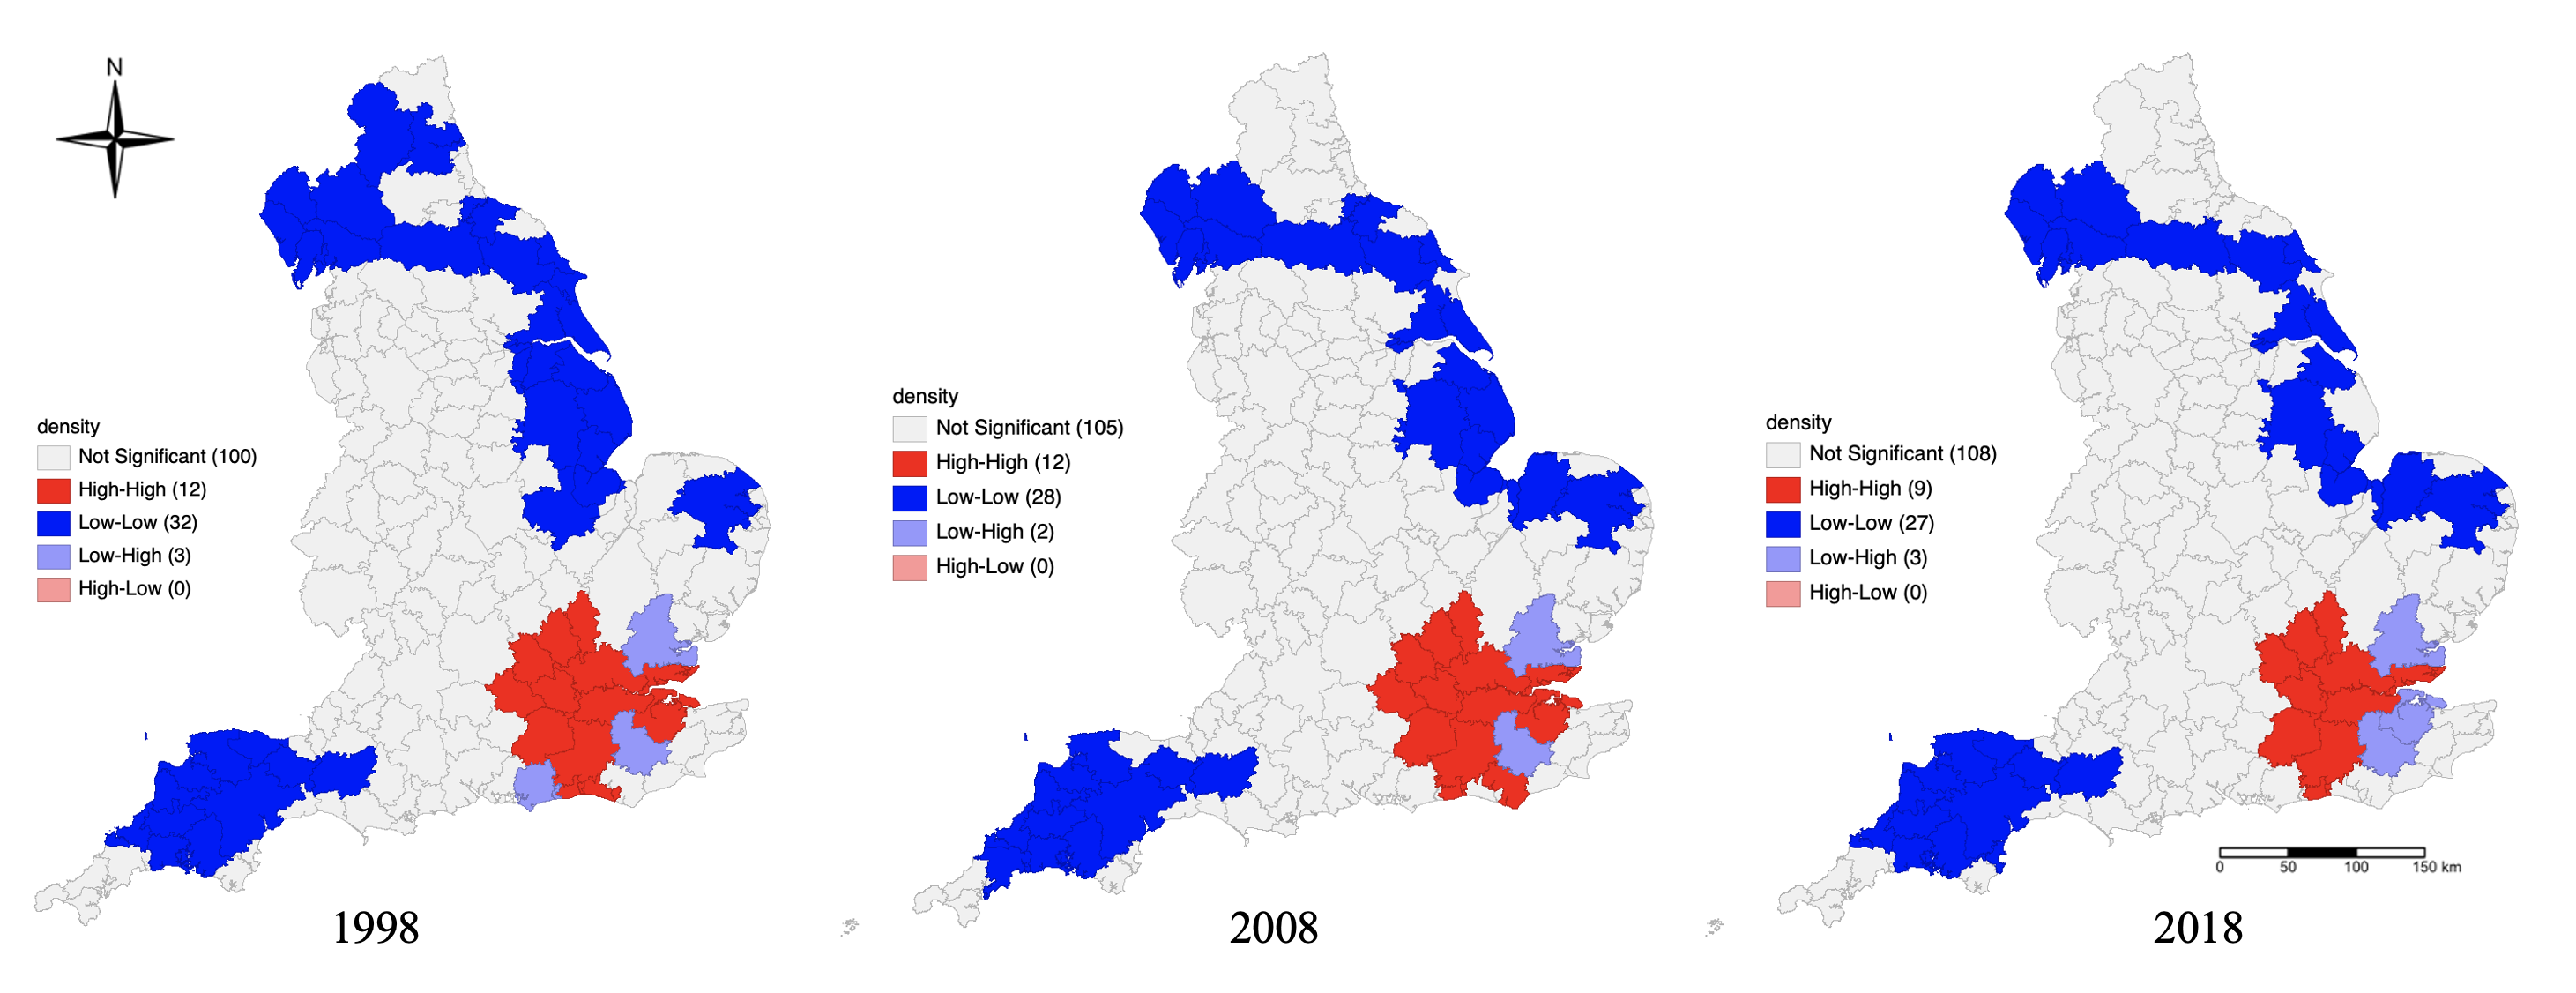
Figure 5.1: Local Moran’s I Cluster Analysis for Firm Density in England for Three Time Periods
5.2 Limitations and Transferability
According to methodology, the method of identifying technology clusters mentioned in the section, the definition of the classification of technology companies comes from 2007. This division of the enterprise may not be the latest and most applicable method. Moreover, their information might be lagging because Office for National Statistics (2015) employed a comprehensive identification method, for example, refer to the code division part of UK Standard Industrial Classification of Economic Activities and the UK government official website Science, technology, engineering and maths graduates in non- Industry definitions in STEM jobs reports, etc. In addition, in the research of spatial pattern mining, there may be a lack of information in some areas. This will lead to low confidence in the local Moran’s index detection, which cannot be discussed as a evidence. Finally, the study of hot-spot only calculates the significance standard and only considers univariate to participate in the calculation. The explanatory nature of spatial clustering analysis may not cover most of the scenes because of practical reasons. For example, the dynamics of enterprises are also affected by other factors in the space, such as policies, taxes, etc.
Studying other regions can also utilise the method of this study. For example, research on technology companies can start with company clusters and first quantify firm entry rate and industrial concentration. On this basis, the research can analyse the relationship between cluster characteristics and entry rate through regression models. To further study the spatial correlation of local areas, global and local Moran’s index analysis methods and analysis of hot-spot to research the aggregation phenomenon of a certain index. This helps the government in a specific area to balance the development of each area to eliminate the Matthew effect of a certain industry, thereby realising the fair distribution of social production.
5.3 Recommendations
5.3.1 Corporate Decision-Making and Investment
Regardless of the influence of other UK regions except England area, the northeastern city belt might become a hot-spot for tech firms to enter. Although the southwest region was a cold-spot for that in 2018, the corresponding service infrastructure in the region is likely to be relatively complete because the region was a high entry rate cluster for technology companies to enter in 1998. Meanwhile, it can be found that commuters in a particular travel to work area often have a mature way of commuting from residential areas to commercial areas. This pattern can help us better understand the cluster phenomenon of technology companies. Moreover, when the home location is fixed, practitioners tend to choose work within a certain commuting area. In this case, it is more feasible for companies to hire high-end and stable labor in regions where market competition is less intense than to conduct the same corporate recruitment behaviour in other areas.
On the other hand, places with fierce market competition are likely to be highly attractive to talents, which will change the commuting decisions of individual families. Thus, company investors can also take into account the surrounding areas of London where there will be a greater tech firm entry rate in the future (Figure 4.2). Although this area is often treated as an outlier in the regression analysis results, London and its surrounding satellite cities may have very different corporate dynamics compared to other areas in England.
5.3.2 Government Policy and Strategy
Observing the overall situation, according to the experimental results, it could be found that the aggregation effect of the entry rate of enterprises shows a downward trend over time (4.4). From local analysis, the decline in the clustering effect in the northern area, especially the commuter areas in the northeast, is delayed compared to other areas. In terms of government decision-making, the implementation of policies in the northern and southern regions needs to be combined with the local real condition. For example, the government hopes to improve the average level of the number of technology companies in a large area in order to optimise the industrial structure. If the government of England aims to encourage local enterprises to move in or establish themselves, the investment priority can be considered in the cold-spot cluster area. Because increasing the enterprise entry rate in a certain area of the cold-spot cluster can eliminate the generation of low-low clusters to a certain extent in the spatial pattern. This is conducive to guiding the industrial balance between regions, thus weakening the Matthew effect.
From the perspective of the direct role of the government, such as the implementation of tax incentives for technology companies, and regional rental incentives to increase the entry rate of local enterprises. In terms of indirect action, the government can increase the entry rate of local enterprises by guiding the diversified development of regional science and tech industries and appropriately increasing the density of regional science and technology enterprises. According to the experimental results of (Table 4.2), the entry rate of enterprises in a certain area in a certain period of time is positively affected by the density of regional enterprises and the concentration of enterprises (Herfindahl-Hirschman Index ).